
Every presentation your reps build in SAGE records a decision. Which customer it's for, which products made the cut, which suppliers they lean on. Then the presentation goes out and that information mostly sits there. Nobody rolls it up, and nobody asks what it says about the team.
I wanted to see what happens if you capture that data automatically and put it somewhere you can ask questions of it. So I built a small demo using SAGE's Presentation Push webhook, Zapier, Zoho Analytics and Claude. This post covers what it does, what it turned up, and how you can build your own even if you've never touched an API.
What I built
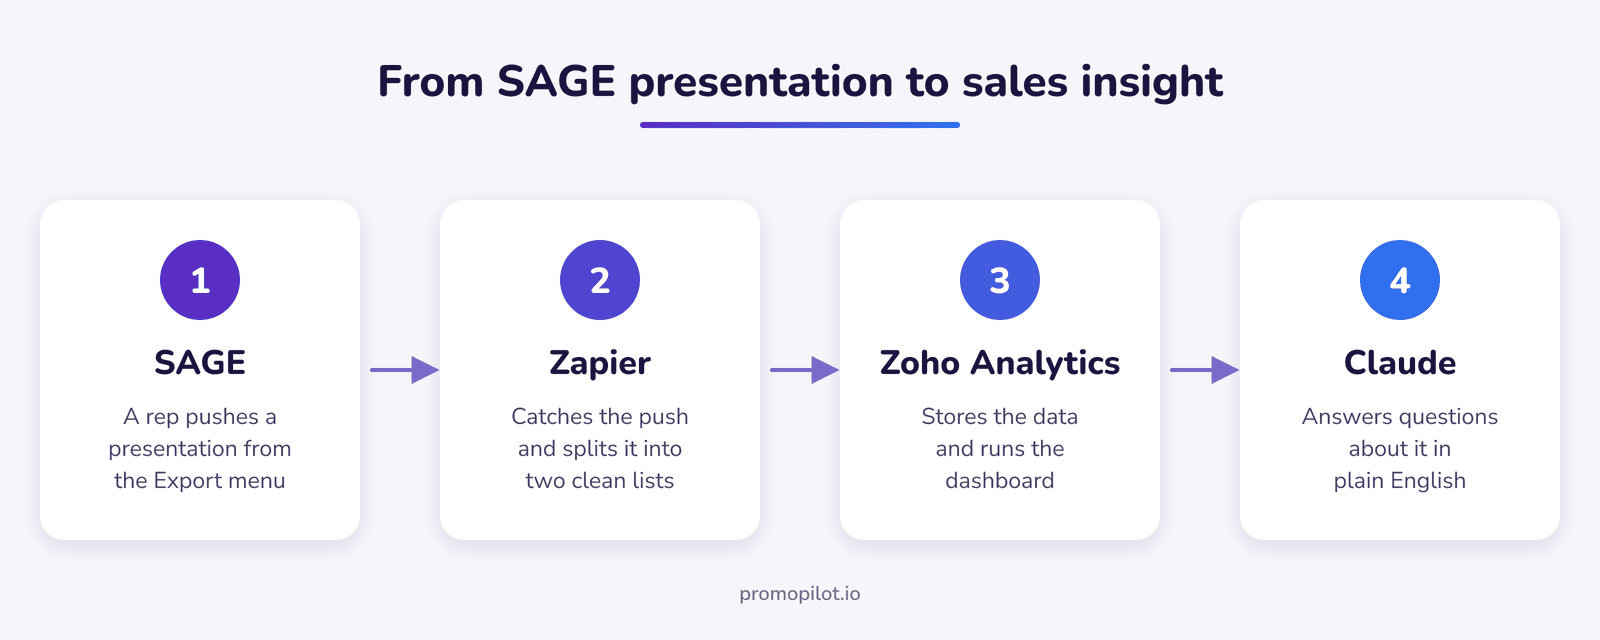
The setup has four parts.
- SAGE Presentation Push. A rep clicks a button in SAGE and it sends a copy of the presentation out as data: the customer, the rep, and every product with its supplier and category.
- Zapier. It catches that push and reshapes it into something a database can use.
- Zoho Analytics. It stores everything in two tables, one for presentations and one for the products inside them, and runs a dashboard on top.
- Claude. Connected to Zoho Analytics, it answers questions about the data in plain English.
I deliberately kept the data small. It tracks who presented what to whom, and when. It leaves out pricing and decoration details for now, because I wanted something a distributor could set up in an afternoon and understand at a glance.
What a webhook is
A webhook is an automatic message one app sends to another the moment something happens. Think of it as a forwarding address. You give SAGE a web address, and every time a rep pushes a presentation, SAGE sends a copy of it there. Nobody exports a file or copies anything by hand.
The usual alternative is polling, where one tool checks another every few minutes and asks if anything is new. A webhook skips the waiting. The data arrives seconds after the rep clicks the button.
SAGE's version of this is Presentation Push. What it sends is organized like the presentation itself: the title, date, rep and customer up top, then a list of every product with its supplier and category. That shape is why the Zap needs a step to split it into two tables later.
Setting it up in SAGE
- In Zapier, create a new Zap. For the trigger, pick Webhooks by Zapier and choose Catch Hook. Zapier gives you a unique web address. Copy it.
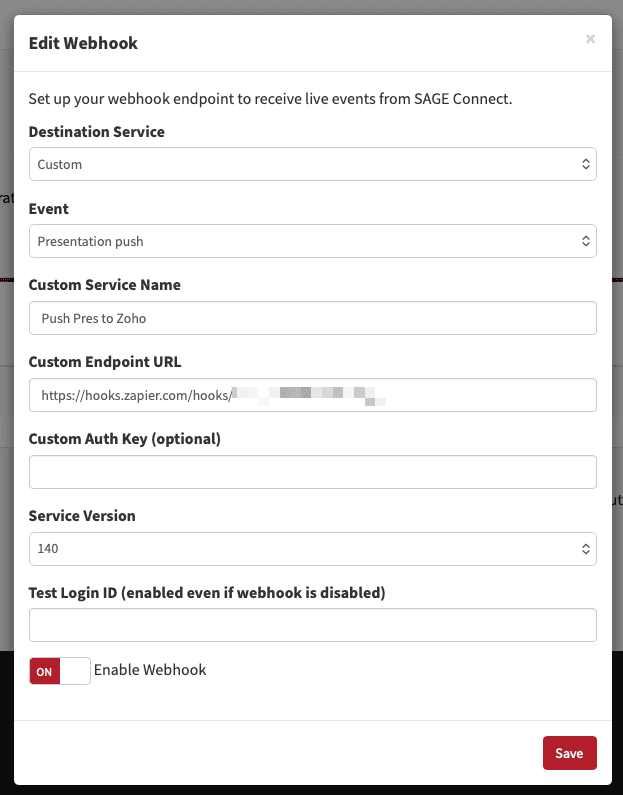
- Log in to SAGEmember.com and go to Developer APIs, then SAGE Connect. On the Webhooks tab, click Add Endpoint. Set Destination Service to Custom and Event to Presentation push. Give it a Custom Service Name your reps will recognize, paste the Zapier address into Custom Endpoint URL, make sure Enable Webhook is on, and save. The name matters: if you call it "Push Pres to Zoho," reps will see "Push Pres to Zoho" when they export. You may need a SAGE account admin to do this step.
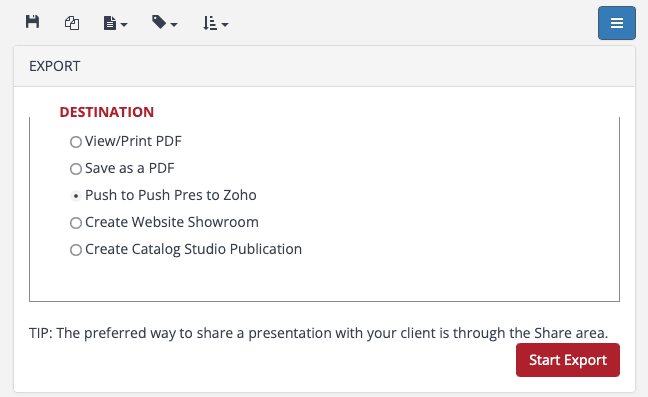
- Open any presentation and go to Export. Under Destination, choose the webhook you just named, then click Start Export. From then on, sending a presentation to Zapier is just another export option, right next to Save as a PDF.
- Back in Zapier, test the trigger. You should see the presentation come through with the customer, the rep and each product.
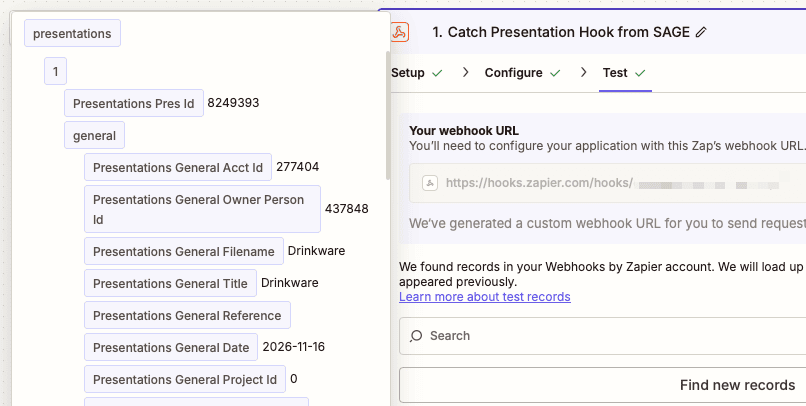
Treat that Zapier address like a password. Anyone who has it can send data into your Zap, so don't post it anywhere public.
One thing to expect: after a push, SAGE may show an error even though Zapier got the data. SAGE expects a specific reply that Zapier's Catch Hook doesn't send back. Check the Zap's history to confirm the push arrived and ignore the message. If this bothers you, ask Claude about Zoho Catalyst. 😉
Once a real push shows up in Zapier, the hardest part is behind you. Everything after that is reshaping data you already have.
How the data gets from SAGE to the dashboard
- A rep finishes a presentation and pushes it from SAGE.
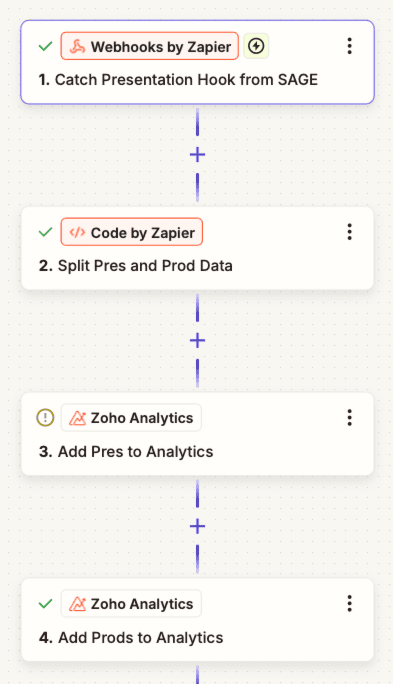
- Zapier receives it. A short code step splits it into two lists: the presentation details, and one line per product.
- Zapier sends both lists to Zoho Analytics. If the same presentation is pushed again later, the existing rows are updated instead of duplicated, and products the rep removed drop out of the reports.
- The dashboard picks up the change, and Claude can query it right away.
What a sales manager sees
The dashboard answers the questions I'd want answered on a Monday morning:
- How many presentations each rep sent, and how many products, suppliers and customers that covered
- Presentations by month, broken out by rep
- Which product categories show up most
- The most presented suppliers and products
- Which suppliers each rep relies on
- Each customer's last presentation date, and how many they've received
You can filter the whole thing by date range, salesperson or category.
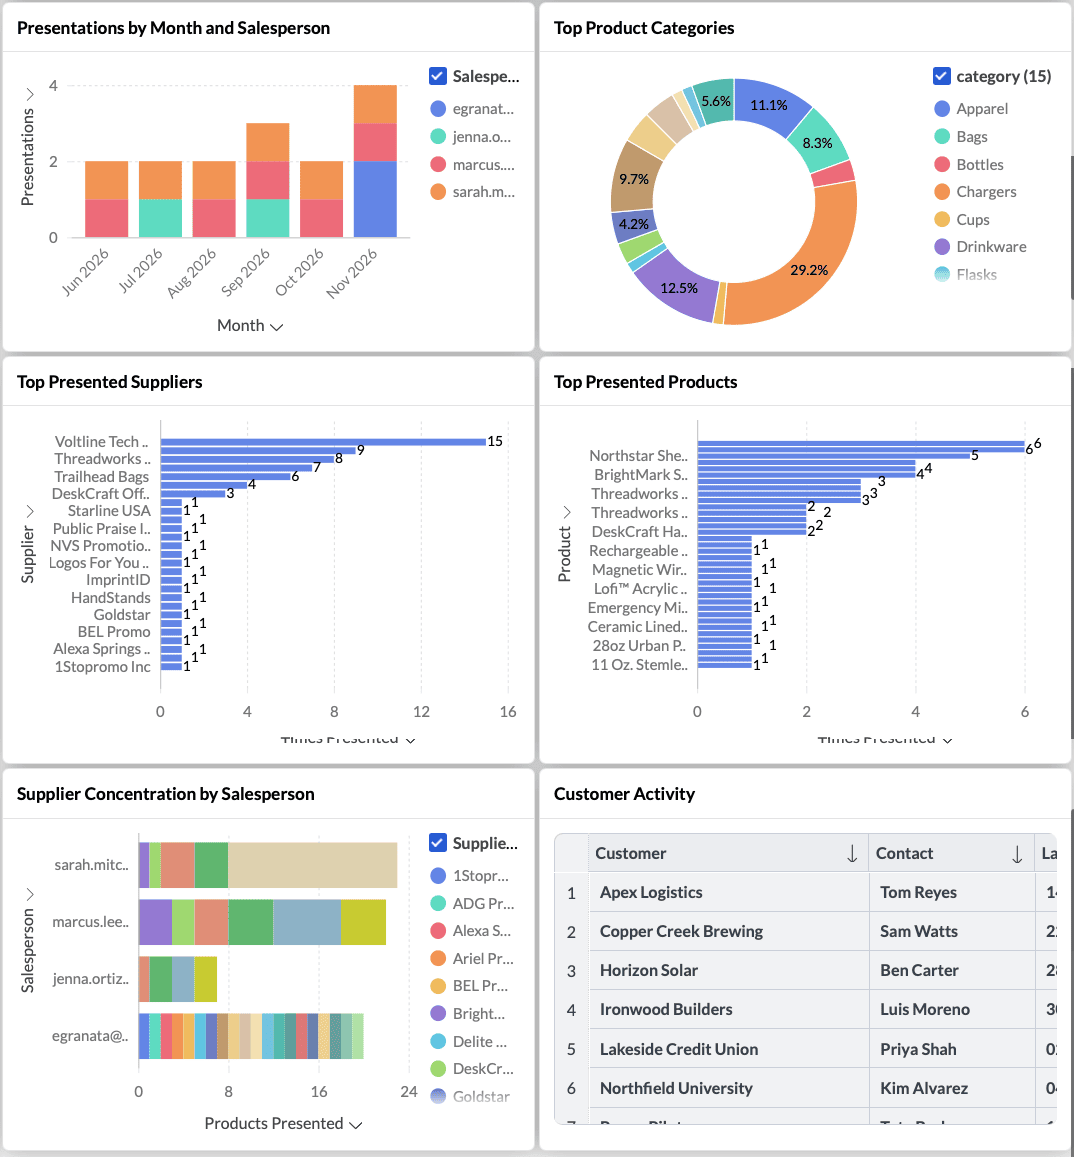
One caveat about the numbers in this post: a demo with one presentation isn't much to look at, so I added some made-up presentations alongside my real tests push. The reps, customers and suppliers in those are fictional. The patterns below come from that demo data, but they're the kind of thing real data turns up.
Asking Claude what the dashboard can't tell you
A chart shows you what happened. The useful part is connecting things across charts, and that's where Claude earns its spot. I connected it to Zoho Analytics via Zoho MCP and asked three questions a sales manager might actually ask.
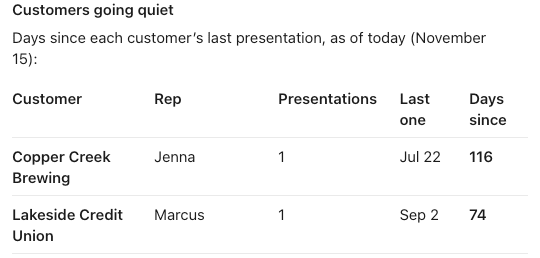
"Which customers are going quiet?"
Claude worked out how many days it had been since each customer's last presentation. Copper Creek Brewing hadn't seen one in 116 days, Lakeside Credit Union in 74, and Ironwood Builders in 46.
Then it noticed something I hadn't asked about. Copper Creek and Ironwood are the only two customers Jenna works with, and she hadn't presented to either since September 30. That's less a customer problem than a question about Jenna's workload. It also pointed out that all three quiet customers had received exactly one presentation, while every customer who got a second one was still active.
"Is any rep too dependent on one supplier?"
Yes. 65% of the products Sarah presented came from a single (fictional) supplier, Voltline, and that supplier showed up in all six of her presentations. Every Voltline product the team presented came from Sarah. Marcus, by comparison, spread his presentations across six suppliers with none above 27%.
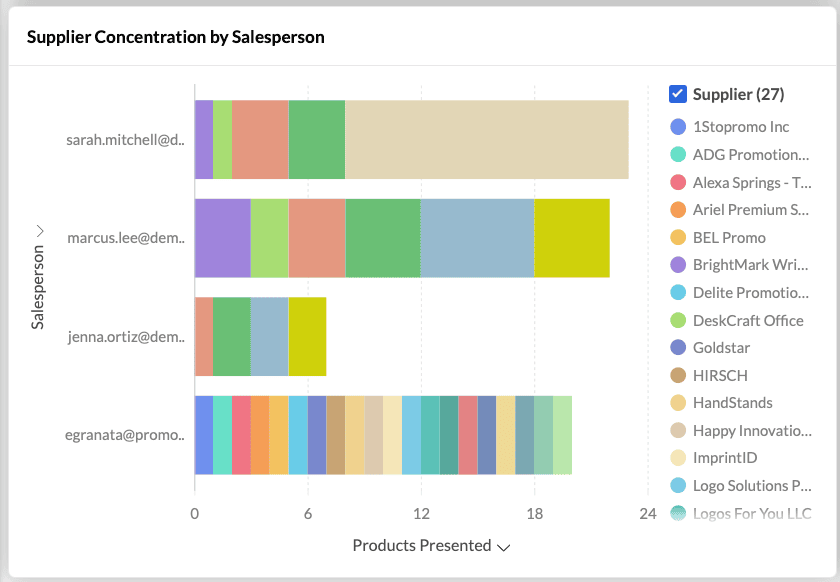
"Are my reps too focused on one category, or missing any?"
Chargers made up 52% of what Sarah presented, and she had never presented apparel or bags. Marcus had the opposite gap: a balanced mix, but no chargers at all, even though chargers were the team's biggest category at 34%.
None of these answers is on the dashboard. Each one took several queries and some cross-referencing, which is exactly the tedious work most managers never get around to.
Not technical? You can still build this
Two steps in the Zap look intimidating: the code step that splits up the SAGE data, and the API request that sends it into Zoho Analytics. If you don't write code, you have a couple of good options.
The first is to ask an AI assistant. Paste a sample of the SAGE data into Claude or ChatGPT, describe the two tables you want, and ask for the code and the exact settings for each Zapier step. That's how I built mine. When a step failed, I pasted the error back in and we fixed it together.
The second is Zapier's newer Next Gen Zaps experience, where you describe the workflow in a chat and Zapier builds it for you. You still decide what goes where. You just don't have to wire every field by hand.
The Zoho Analytics side works the same way. Zoho offers an MCP connection that lets Claude work inside your Analytics account directly. Claude created my workspace, both tables, the summary views and the first draft of every chart through that connection. The connection couldn't handle a few things, like linking the two tables, renaming chart labels and adding the dashboard filters. For those, Claude used its built-in browser and clicked through the Zoho screens itself while I watched the Automate & Elevate replay.
What this data can and can't tell you
A presentation is a recommendation, not a sale. The customer might pick one product out of ten, and the price and quantity often change before anything gets ordered. So this setup tells you what your reps are recommending, to whom, and how often. It doesn't tell you revenue, margin or which presentations turned into orders.
That matters when you read the results. A "quiet" customer might be in the middle of a big order you can't see here. Treat these insights as prompts for a conversation, not verdicts. Tying presentations to quotes, orders or CRM data is the obvious next step if you want to measure what actually converts.
Where to start
Start smaller than you think. Turn on Presentation Push, catch a few real presentations in Zapier, and get them into two tables. Even a couple of months of data will show you which suppliers your team leans on and which customers you haven't talked to lately. Add the dashboard and Claude once the data is flowing.
If you get stuck building your own, come find me in the PromoPilot Aviators community. I'd rather help you get it working than have the idea sit in a bookmark folder.